Case study
COPRETI interactive map: child labor data visualization
An interactive map viewer that brings together quantitative data and field accounts on child labour across six productive areas of Buenos Aires Province.
Project sheet
- Client
- COPRETI
- Year
- 2022–2023
- Services
- Map viewer development · Geographic data processing · Iconography adaptation · UX
- Tech stack
- Leaflet · GeoJSON · JavaScript · Bootstrap · HTML/CSS
The Challenge
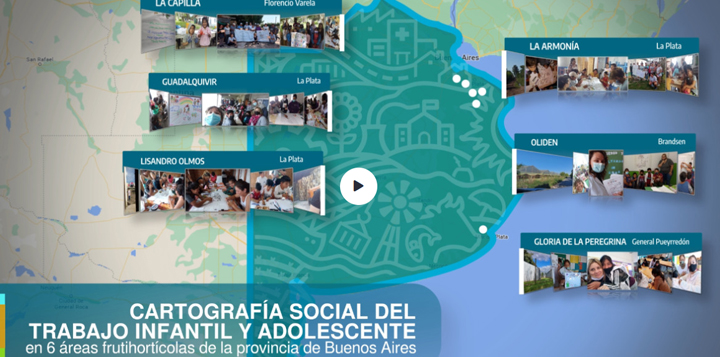
COPRETI had carried out a one-off survey in six productive localities of Buenos Aires Province. It combined quantitative indicators per census tract with qualitative field material: photos, audio recordings and testimonies. They needed a tool that brought everything onto a single map, stayed accessible to non-technical audiences and respected the visual identity their own team had drawn by hand.
Our Solution
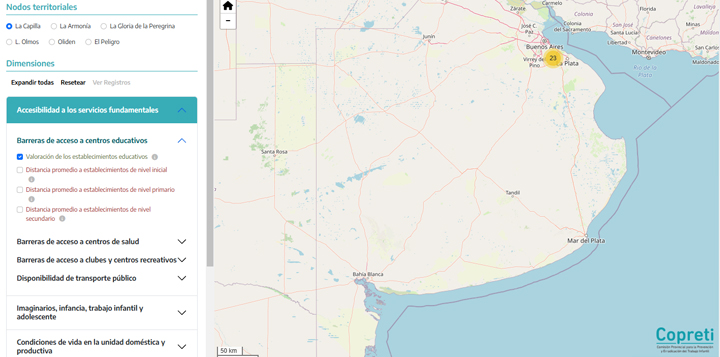
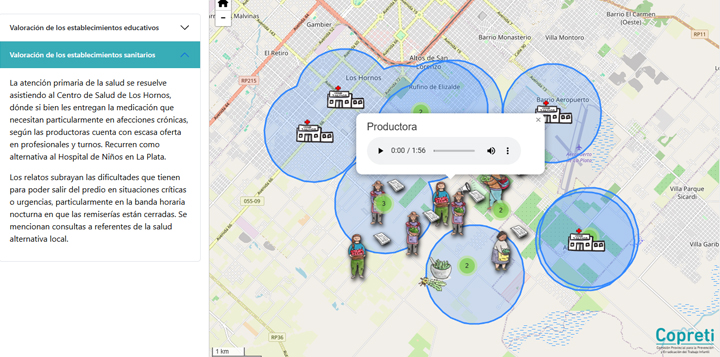
We built the map viewer embedded in the organisation's official site. Data is organised by territorial node, dimension and variable, with toggleable layers and a methodology sheet for each indicator. We processed and adapted the client's hand-drawn icons into map markers. Each figure has variants by content type (photo, audio, text, video) and alert level, so the territory can be read at a glance. We added clustering that expands on zoom, popups with galleries and audio, and a mobile-friendly layout.
Visual Gallery
Results & Impact
- Six surveyed productive areas, brought together on one navigable map.
- More than 370 geographic layers and 43 variables documented with their methodology.
- Field testimonies, photos and audio geolocated alongside the data.
- A bespoke iconography that carries the client team's perspective onto the map.